Re: Electric Fields
Date: Mon Aug 10 12:03:03 1998
Posted By: Jason Goodman, Graduate Student, Massachusetts Institute of Technology
Area of science: Physics
ID: 902439895.Ph
Message:
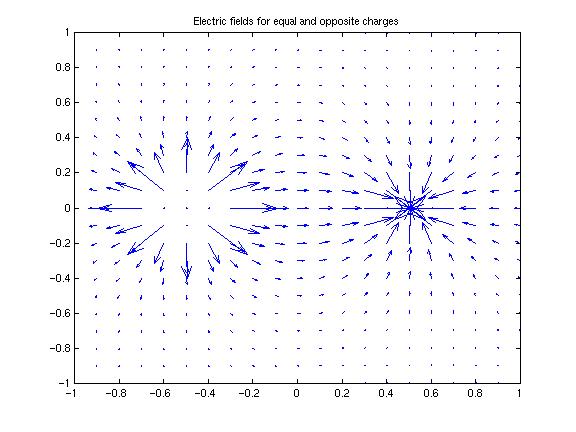
Note: I've included two figures in this answer which show the sort of
graphics your program should produce. I don't want to take the wind out of
your sails by suggesting I've already written your program: I used a
commercial software package called 'MATLAB' to generate these figures, and
I haven't the faintest idea how to write a program which produces them --
that's your job.
I know that the total strength between two point charges is
(kQ1Q2)/d^2.
This formula gives the force on a charge Q1 due to the presence of a second
charge, Q2. The field is defined as the force per unit
charge on a tiny "test charge" dQ in the presence of a charge Q: using
the same formula above, but changing notation,
F = k dQ Q /d2

     F     k Q
E = --- = -----
     dq     d2
Three more things you need to know:
- The electric field E is a vector. It has a
magnitude and a direction. The equation above is for the
magnitude; the direction is always away from the charge Q (for
positive Q). You have to draw the electric field as an
arrow pointing toward or away from the charge. The x and
y components of this vector can be written
     F     k Q x
Ex = --- = -----
     dq     d3

     F     k Q y
Ey = --- = -----
     dq     d3
where x is the horizontal distance from the charge, y is the
vertical distance, and d = sqrt(x^2+y^2) is the total distance.
Ex is a vector which points in the x
direction (toward the right), and Ey is a vector pointing
in the y direction (upward). The total field is the sum of these
two vectors -- for example, if Ex is positive (rightward)
and Ey is negative (downward), the total E vector
points down and to the right.
- The electric field of several point charges equals the sum of the
electric fields of each. You can compute Ex and
Ey for each charge separately, and add them up at the
end. This is done for two charges in the figure below: notice that the
arrows don't point exactly at one charge or another!
- The concept of an electric potential is useful. The potential
is a scalar (not a vector) whose gradient gives the
electric field. If you don't know calculus, that last sentence didn't make
much sense: I'll just say that the electric potential makes it easy to
calculate the electric field. The electric potential of a point charge is
given by
       k Q
V = - -----
        d
(note only one d in the denominator!) If you know the
potential at every point on a grid V(i,j), you can calculate the
electric field everywhere this way:
   Ex = (V(i+1,j) - V(i-1,j))/(2*deltax)
   Ey = (V(i,j+1) - V(i,j-1))/(2*deltax)
that is, the vertical component of E is given by taking the
difference of V at points above and below the point of interest and
dividing by twice the separation between gridpoints, and the horizontal
component is given by taking the difference between points to left and
right. Watch out for divide-by-zero!
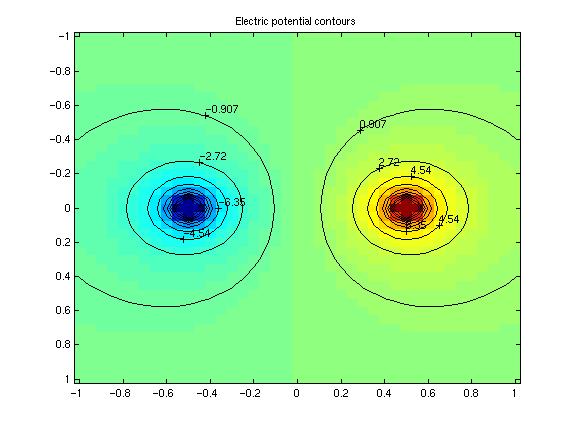
This is the technique I used to generate the first figure. Another useful
graphic is to display contours of the potential itself: the electric field
is strongly positive near positive charges and negative near negative
charges: the electric field is perpendicular to the contours of
the potential, and the strength of the field is proportional to the contour
density. Below, I've shown a contour-plot of the electric potential
superimposed on a color-graphic of the potential. Red is positive
potential, blue is negative.
Another useful graphic often shown in textbooks is a plot of electric
field lines. These are lines which always point in the same direction
as the electric field arrows, and which begin and end on the charges.
Unfortunately the graphics program I have can't do this: you might want to
try it yourself.
Current Queue |
Current Queue for Physics |
Physics archives
Try the links in the MadSci Library for more information on Physics.
MadSci Home | Information |
Search |
Random Knowledge Generator |
MadSci Archives |
Mad Library | MAD Labs |
MAD FAQs |
Ask a ? |
Join Us! |
Help Support MadSci
MadSci Network,
webadmin@www.madsci.org
© 1995-1998. All rights reserved.